
PetowoPetowo
A knitted-wool illustration of a depot yard under dark storm clouds with lightning. Pallets and a tall stack of boxes stand unsecured beside a lorry with its curtain open, and three workers look in different directions, unaware.

Solutions / Dashboards

See every site on one page, with no spreadsheet.

For managers and leaders. Share a dashboard once, and each person sees only what their own access allows.

  • Anyone can report from their phone

  • See which controls are really working

  • Fixes are checked before they're closed

  • Your information stays private to you

The problem in your words

Does any of this sound familiar?

  • Month-end spreadsheet

    I spend the last Friday of the month in a spreadsheet.

    Pull the numbers, paste them in, fix the formula. Then do it all again next month, and hope nobody asks where a figure came from.

  • Sites that don't compare

    Every site counts it differently.

    Each has its own board and its own sums, so comparing them starts an argument about the numbers and not the work.

  • Too late to use

    By the time it's on a slide, it's old news.

    Last month's numbers don't help with today's shift, or today's weather. By then, the moment to act has gone.

One set of numbers. Everyone sees their own.

  • Month-end spreadsheet

    Shared by access

    Share a dashboard with roles, groups or named people. Each person's figures are read with their own access, so a site manager sees their sites and the safety lead sees every site. Keep a dashboard private until it is ready.

    A site manager opens Analytics, chooses Shared with me, and opens the Site safety this quarter dashboard with its charts.
    Share a dashboard with a group. Each person sees what their access allows.
  • Sites that don't compare

    Every site side by side

    See every site in one of four places, from its leading and lagging records, with those reporting nothing shown first. Or rank them on one rate, and follow each one's trend over six months.

  • Too late to use

    A board for the huddle

    Each letter on the safety, quality, delivery and cost board is judged met or missed against that place's target. A miss needs its issue, can raise an action, and can go up to the place above. What the places beneath pass up shows there too.

  • Sites that don't compare

    Measures that say how they are worked out

    Say what you measure and how each measure is worked out, then follow it on a scorecard. LTIFR, TRIR and severity rate come ready, beside your own. Screens say which place and what time the figures are from.

  • Too late to use

    The weather at every site

    Conditions shows what the weather is doing at every place you operate, read every hour, beside everything else. Each report can carry the conditions at that place and time.

  • Make it yours

    Start from the ready-made dashboards, then build your own charts. Share each one with the people who need it.

Works with what you do already

Behind every number, a record.

The figures are read from the records people keep in Petowo. Open a report, and you can see what the board said that day.

Potentially relevant

  • Reports

    Counted under Safety on the board, for each place.

  • The day's board

    Shown on a report, for its place on the day it happened.

  • Huddle actions

    Raised from a missed letter, with an owner and a date.

  • Measures

    Counted from your own records, and filed under a letter on the monthly board.

Petowo shows what these records have in common. Your people decide what it means.

What people ask us

Will a site manager see every site?

No. A dashboard can be shared widely, but each person's figures are read with their own access. Two people can open the same dashboard and see different sites, and neither of them has to ask for a special copy.

Can we get the numbers out?

Yes. Each chart downloads as a CSV file, and a dashboard can be printed. You can also ask for a weekly or monthly email with the dashboard's name and a link. The figures themselves stay in Petowo, behind each person's own access.

Do we need an analyst to build charts?

No. Start from the ready-made dashboards, then build your own by choosing what to show and how to draw it, from a single number to a chart. Move and size each one on a grid. Then decide who it is for: only you, everyone, or chosen roles, groups and people.

Can we track our own rates?

Yes. LTIFR, TRIR and severity rate come ready, and you can define your own measures and say how each one is worked out. The same measures feed your scorecards and your site comparisons, so a number means one thing.

How up to date are the numbers?

They are read from your records when you open the page. The screen says which place and what time the figures are from, such as “Main depot, as at 14:05”, so nobody has to guess how old a number is. Each chart's caption says what it counts. Conditions is read fresh each time you open it.

Where does the weather come from?

From a weather service, read for each place you operate, and marked as retrieved, not typed in by a person. An administrator can choose the supplier and add your own key.

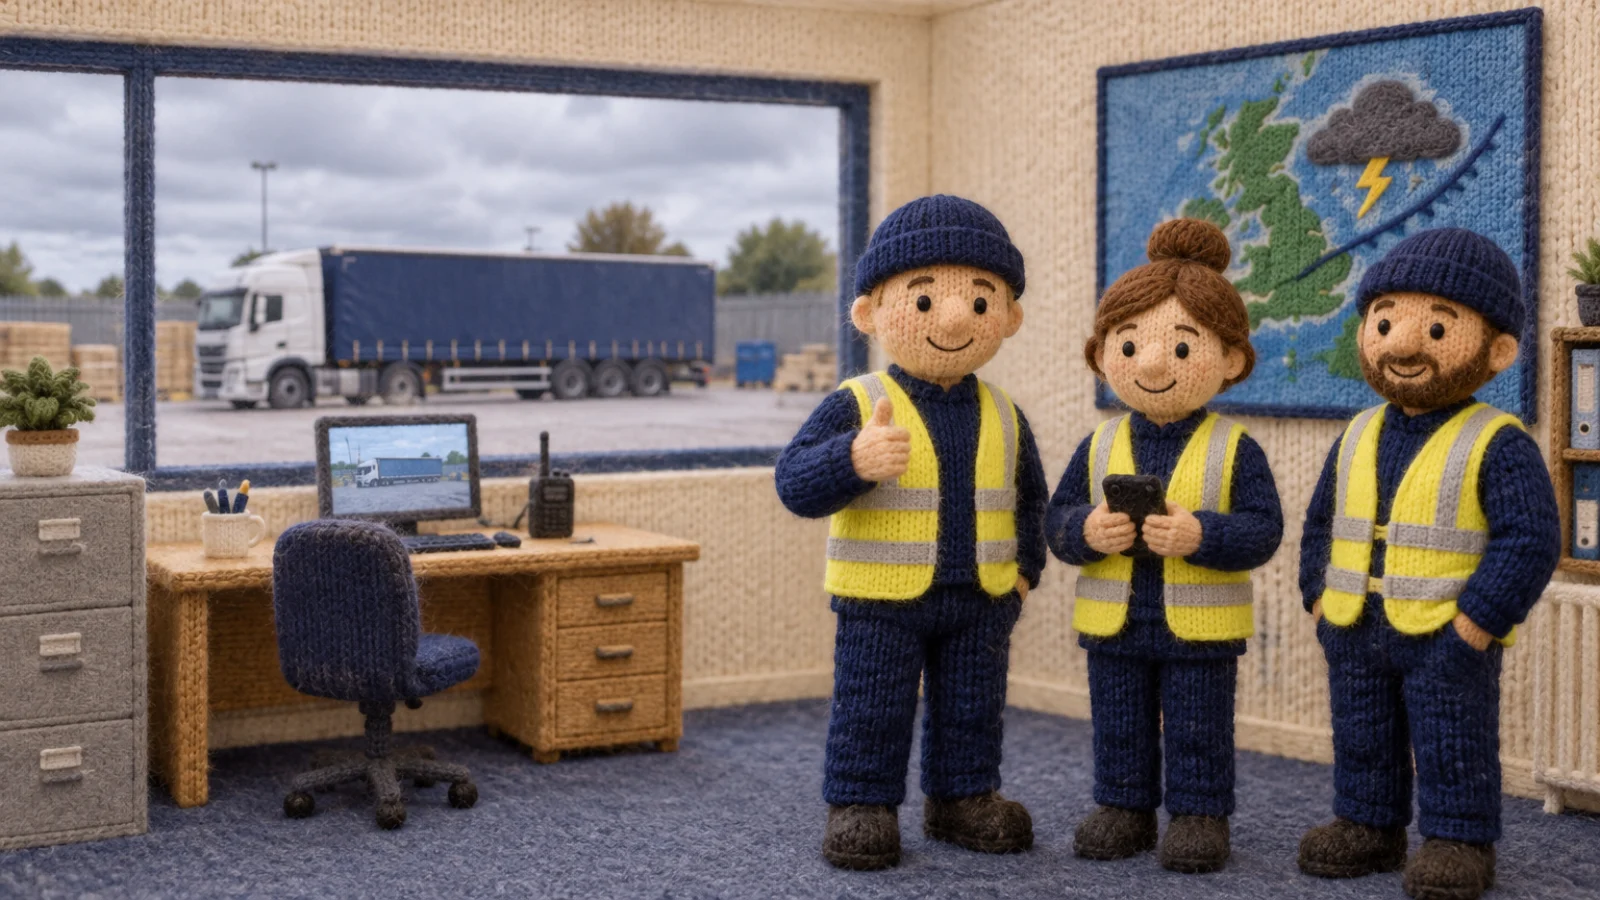
A knitted-wool illustration of a depot control room. Three workers smile in front of a big screen showing a weather map with a storm icon. Through the window the lorry's curtain is closed and the pallets are strapped down.

Every site on one screen, before the weather turns.

Bring the report you build by hand each month, and we will show you it in Petowo.